How to View Error Logs in cPanel

This article will show you how to view error logs in cPanel.
Before you start: this shows the Apache error log, which records server-level errors such as permission failures and PHP fatal errors. Application logs, including the WordPress debug log, are separate and live in the site's own directory.
1. Log in to cPanel
Use your user details to log in to the cPanel control panel.
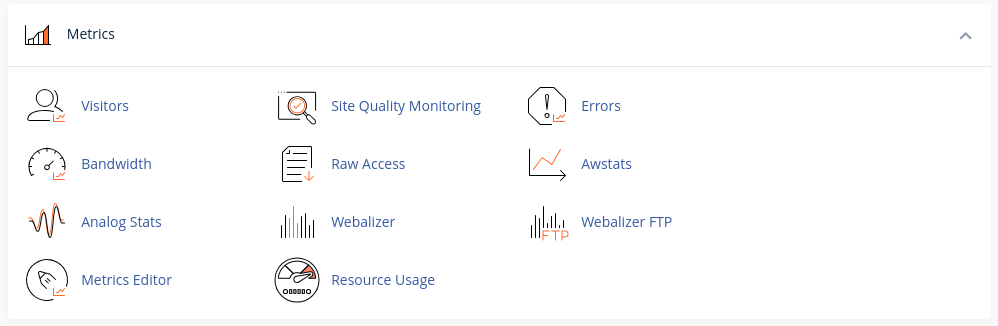
2. Navigate to the Metrics Section
Scroll down and locate the Metrics section in cPanel.
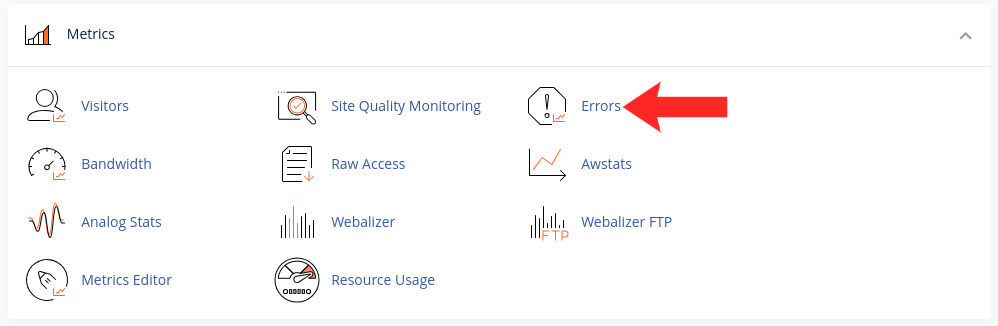
3. Access Error Logs
Click on the Errors option under the Metrics section.
4. View the Error Logs
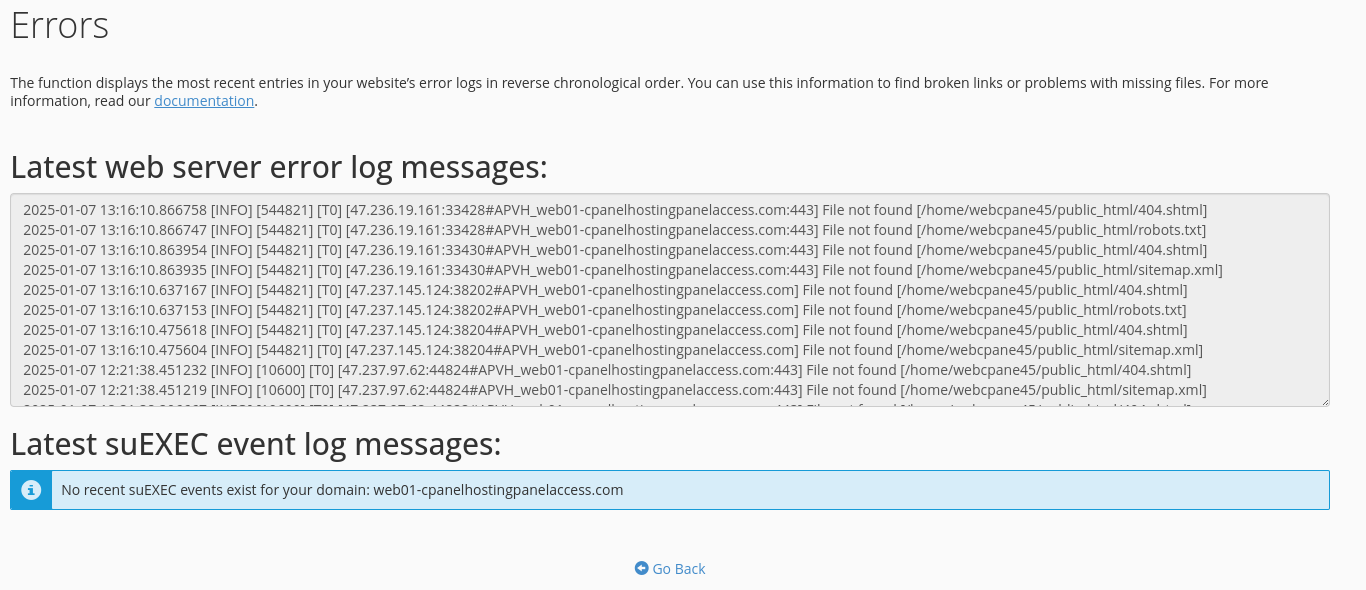
On the Errors page, you will see a list of the most recent errors generated by your website. These logs include details such as:
- Date and Time: When the error occurred.
- File Path: The location of the file or resource causing the error.
- Error Details: A description of the error.
5. Use the Logs for Troubleshooting
- Review the error messages to identify potential issues with your website.
- Note the file paths and error details to make necessary changes or fixes.
6. Interpret What You See
Each entry gives a date, an error type and a file path. The path is the most useful part: it tells you which file caused the problem. Entries repeating every few seconds usually indicate a loop rather than many separate faults.
Next: How to Set Custom Error Pages Using .htaccess shows how to give visitors something better than the default error page.